The Subdomains tab in Advertising Research helps you pinpoint exactly where paid traffic is being driven to within your competitors’ website.
In this report, you’ll see a breakdown of all active subdomains connected to your competitor’s Google Ads activity. This gives you valuable insights into how different parts of their site support different ad campaigns.
Use the Subdomains report to:
- Identify which sections of a site drive the most paid traffic
- Analyze how keyword strategies differ between subdomains
- Spot opportunities to refine your own URL and landing page structure
To access this report:
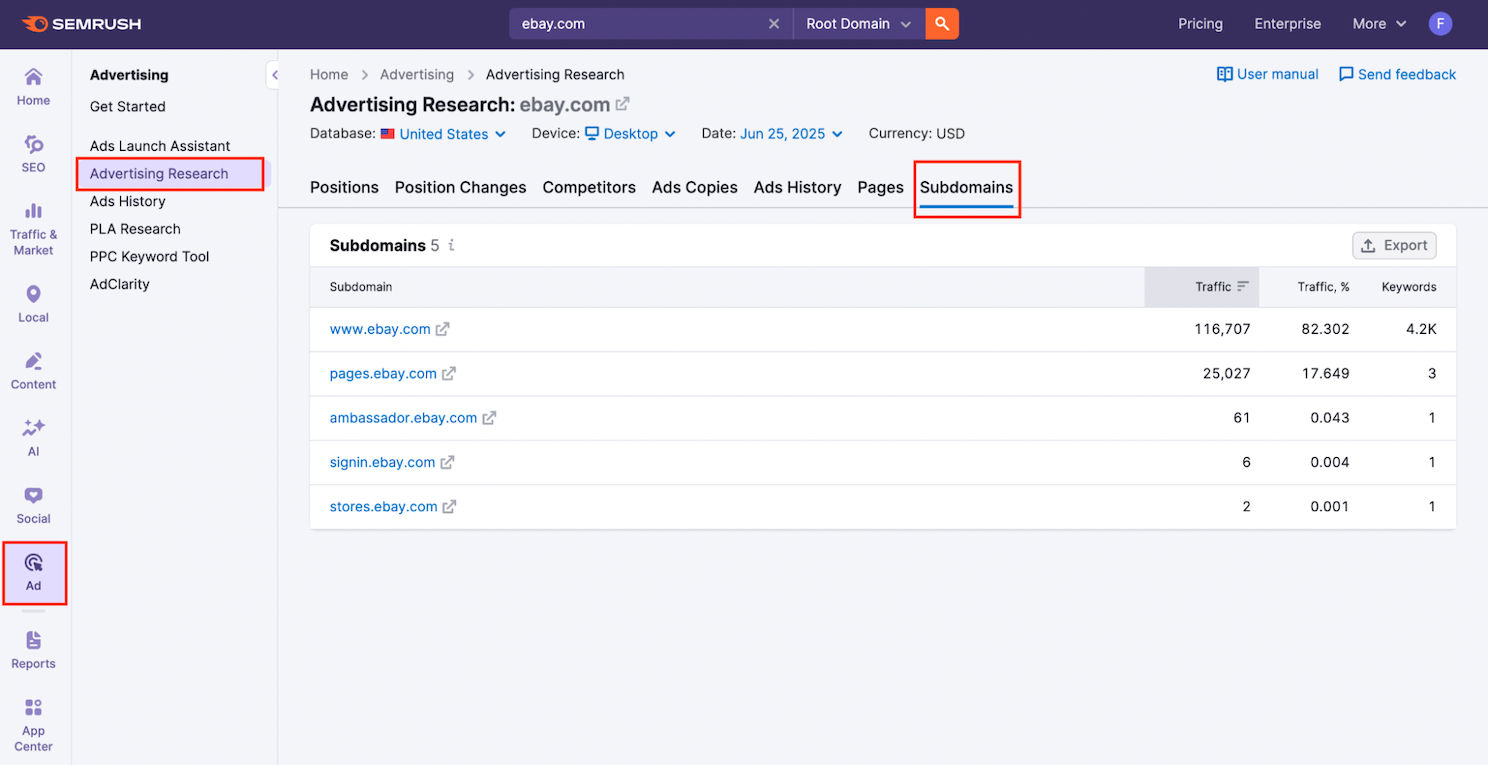
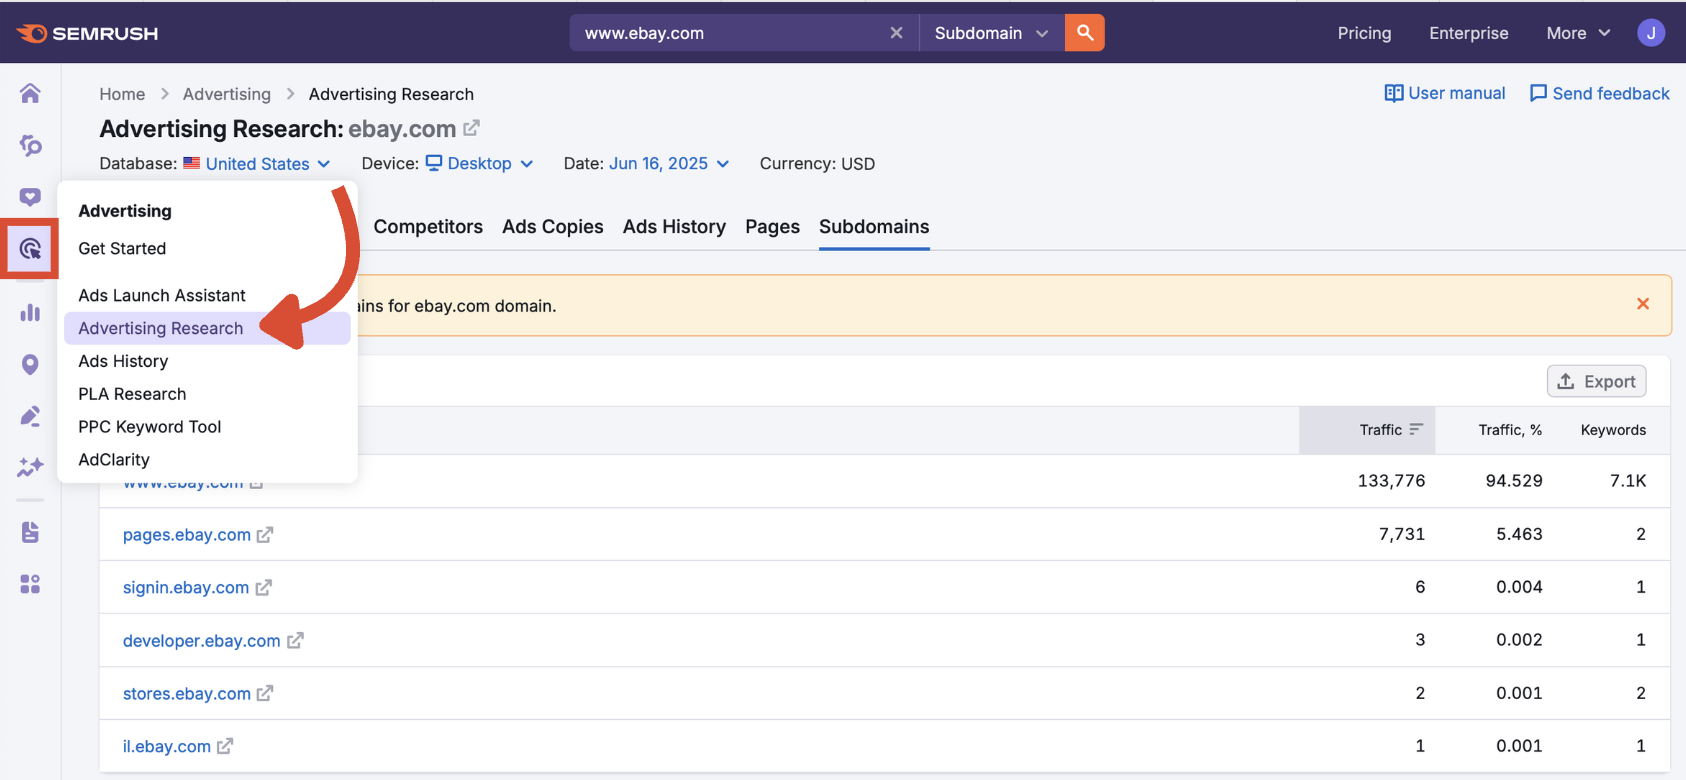
- Open the Advertising Research tool from the left-hand Semrush menu.
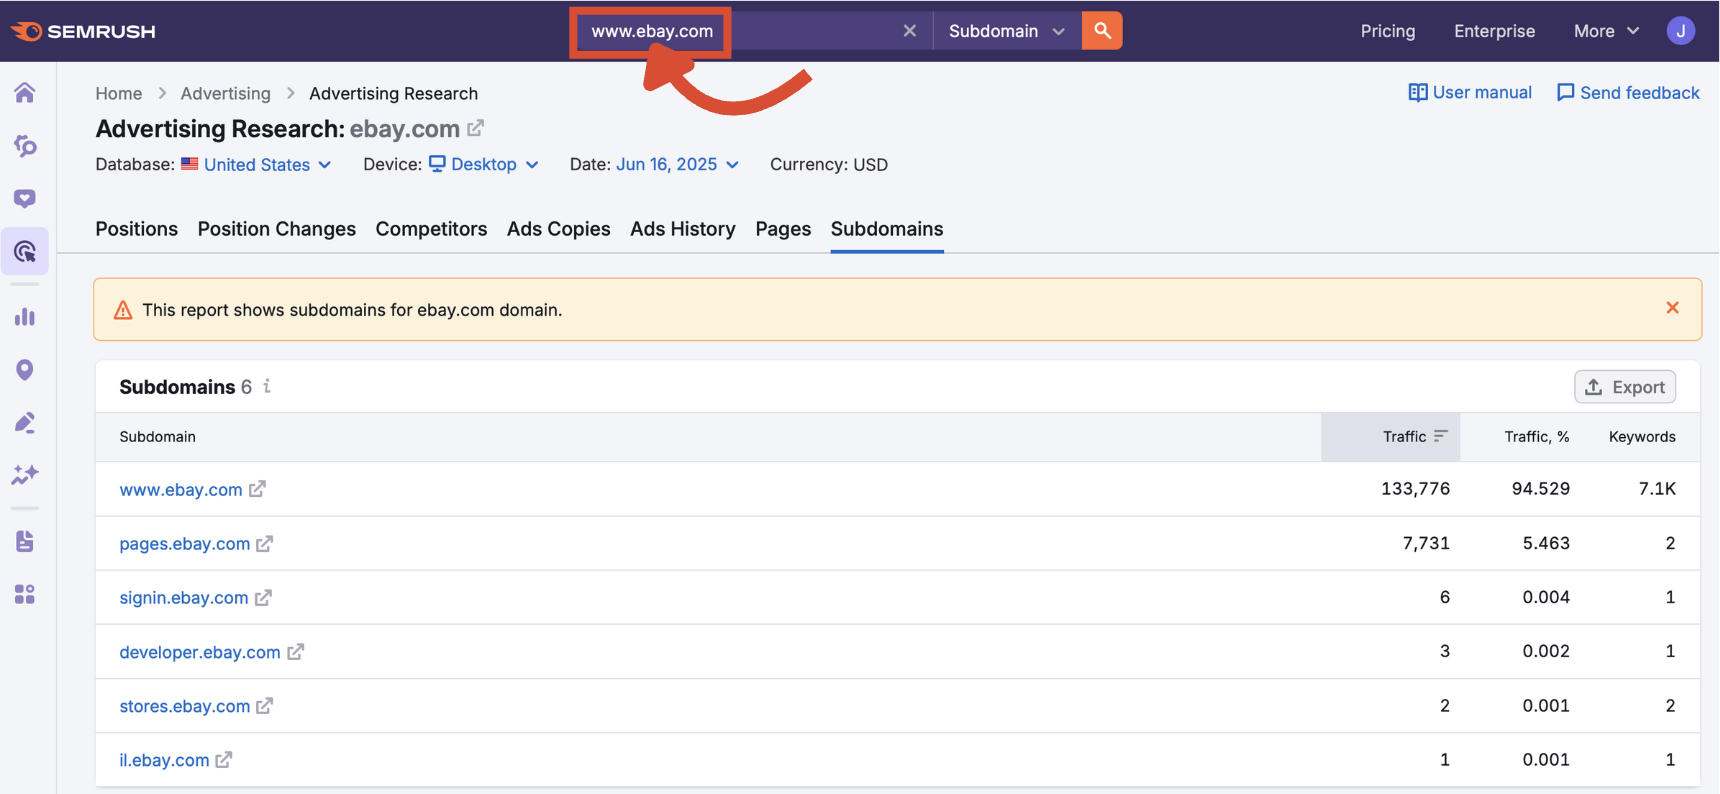
- Enter a domain into the search bar on the Advertising Research homepage.

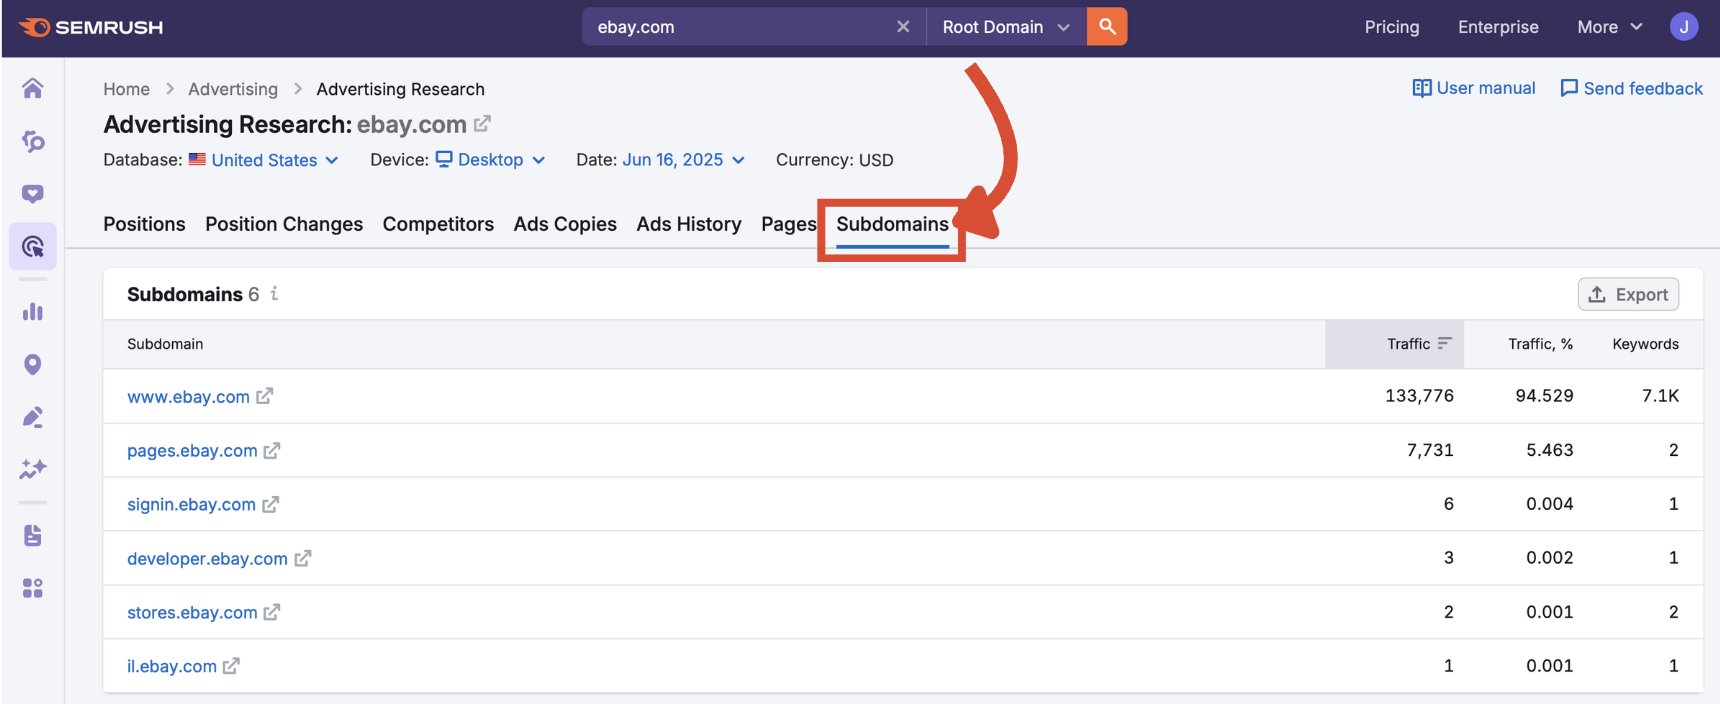
- Click the Subdomains tab in the top navigation.
Step 1: Understand the Macro Settings
Before looking at subdomain performance, make sure your settings reflect the right campaign context for your analysis.
Enter a Domain in the Search Bar
Start by making sure the domain you want to analyze is in the search bar at the top of the tool.
Adjust Macro Parameters
Adjusting the macro settings at the top of the dashboard influences all the data in this view.
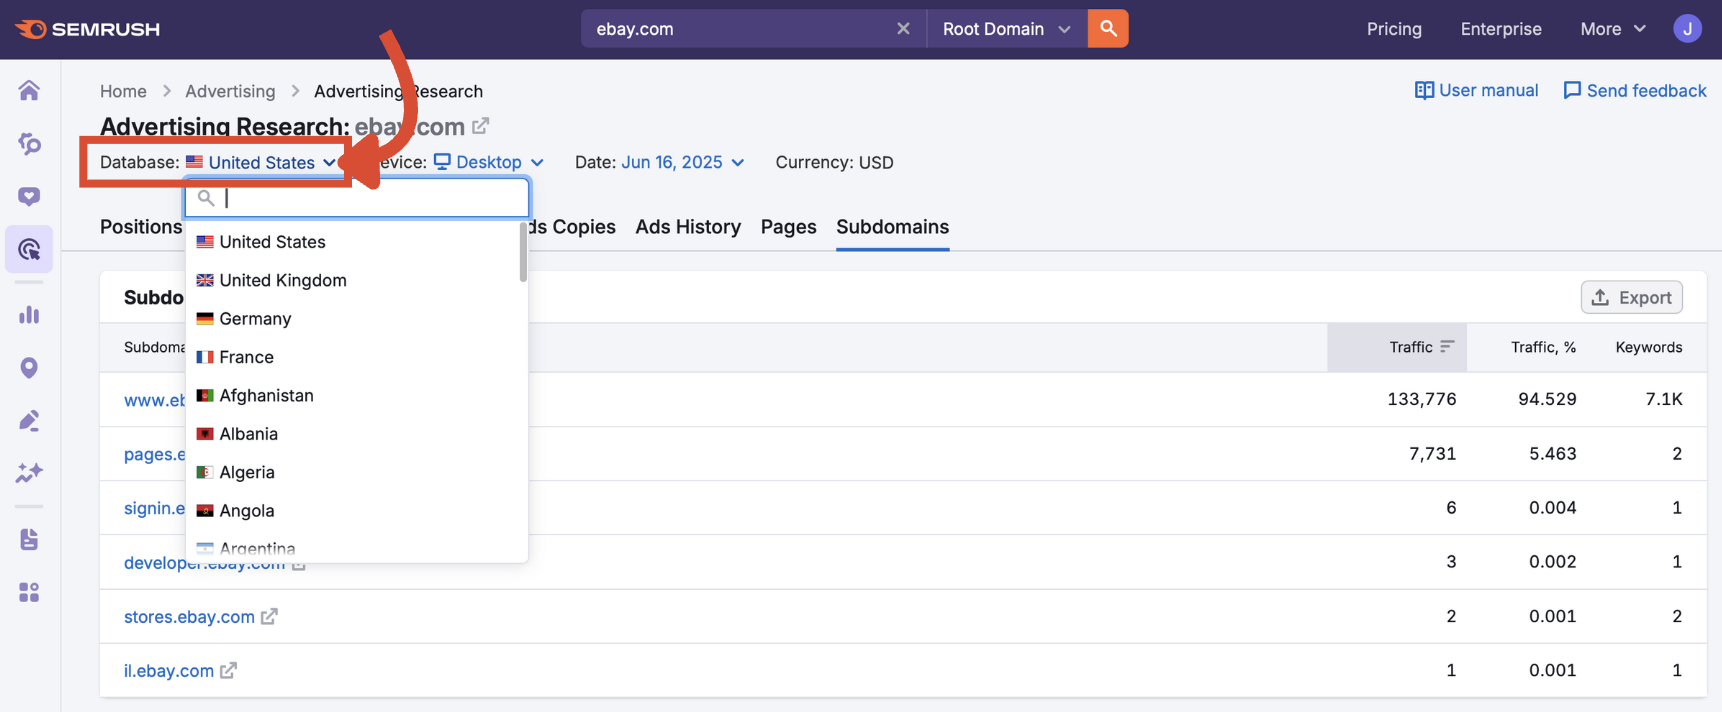
Database
Select a country to see how subdomains perform in that region’s Google Ads market.
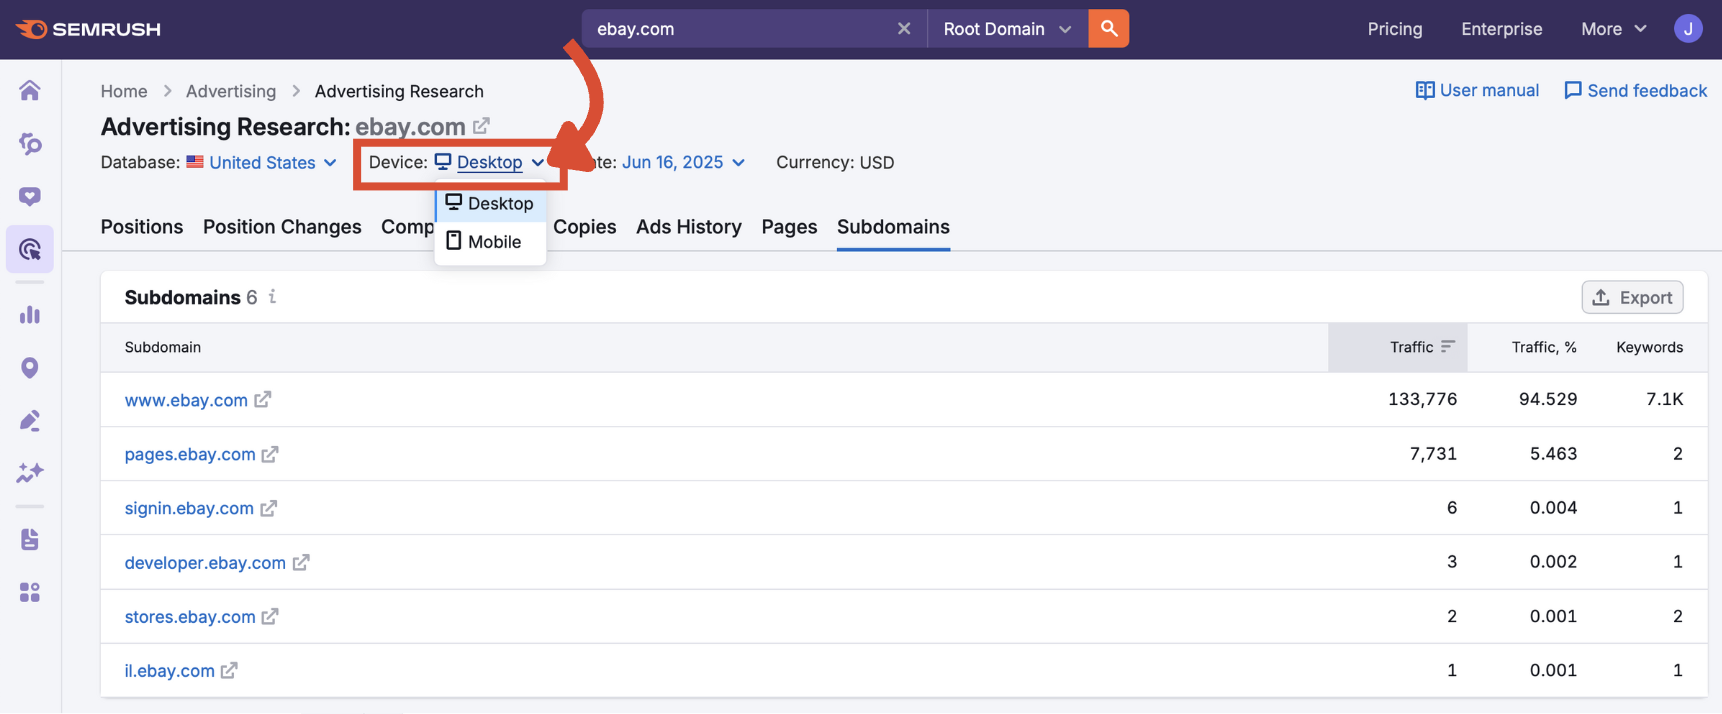
Device
Toggle between desktop and mobile data to match your own ad campaigns primary platform.
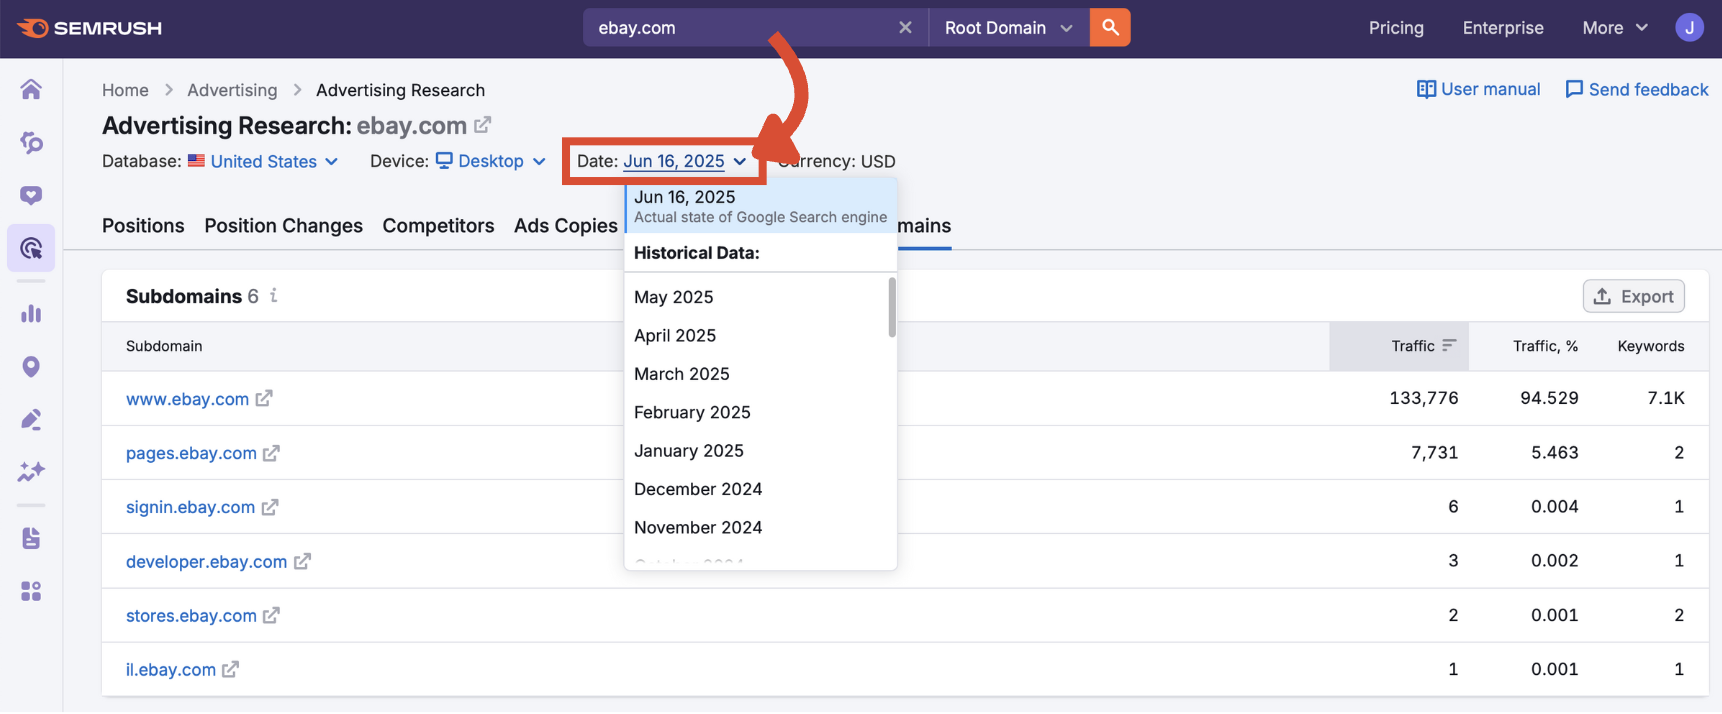
Date
Choose a specific month (going as far back as January 2012) or select the current date for the most recent snapshot.
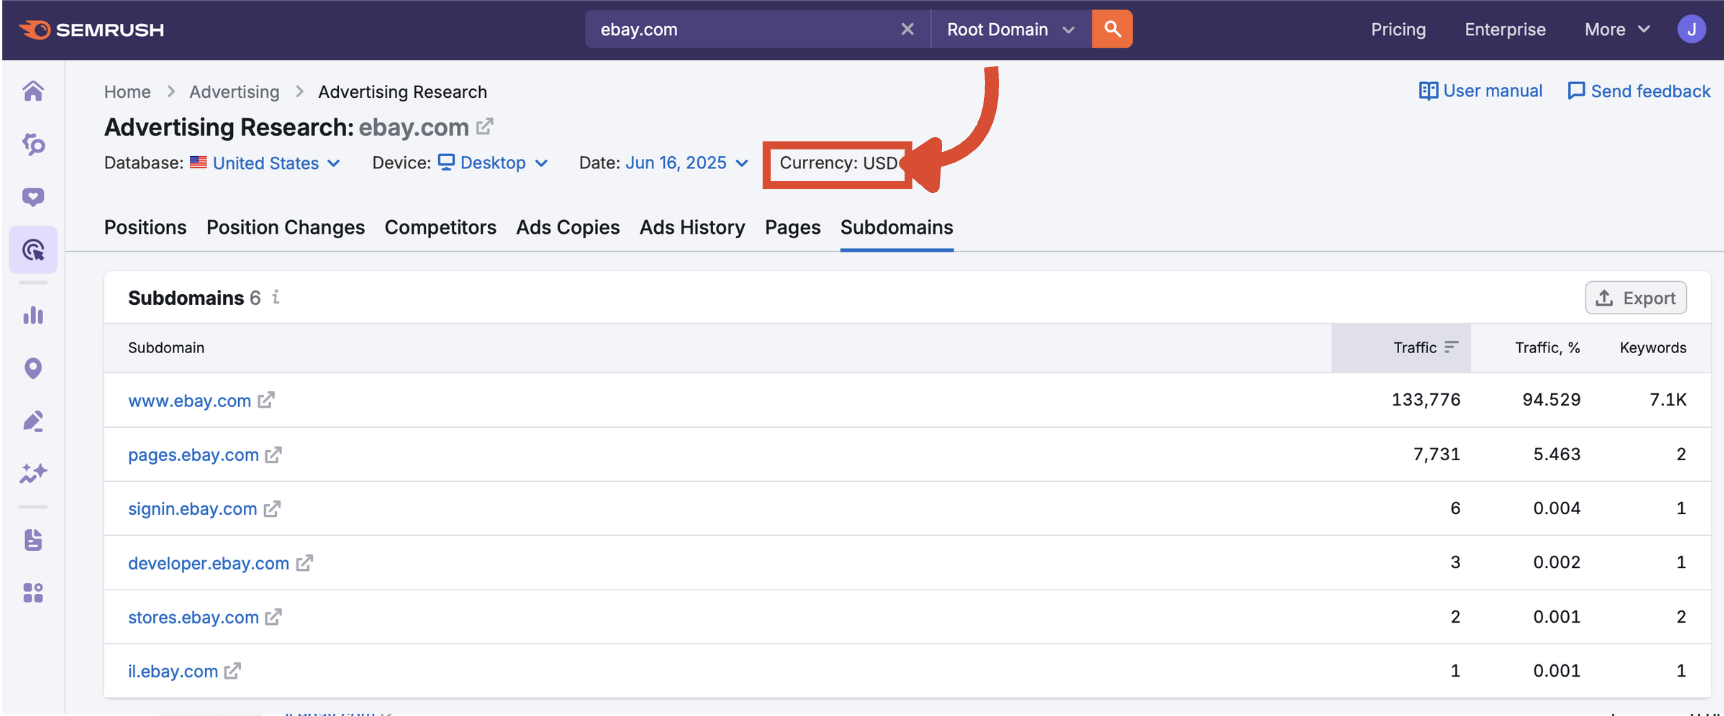
Currency
Adjust CPC values according to the selected country’s currency.
Step 2: Reading the Subdomains Table
The Subdomains table shows you a list of all subdomains that have received paid traffic, ranked by traffic volume. You can also sort by traffic % or keyword count.
Each row in the chart includes:
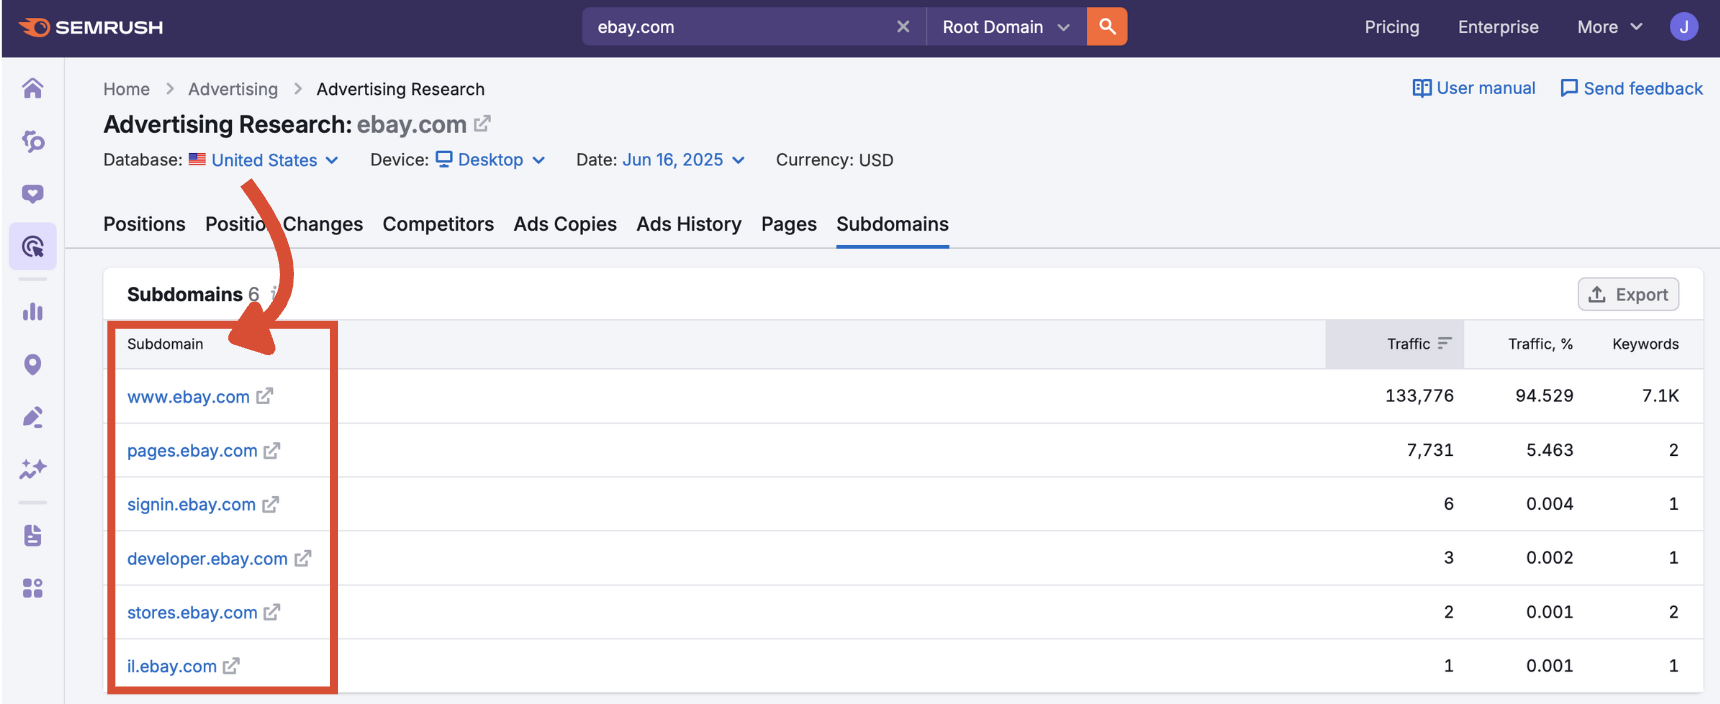
Subdomain
The specific subdomain where ads are directing traffic. Click the blue domain link to analyze it further in the Positions report, or the arrow to visit the subdomain in a new tab.
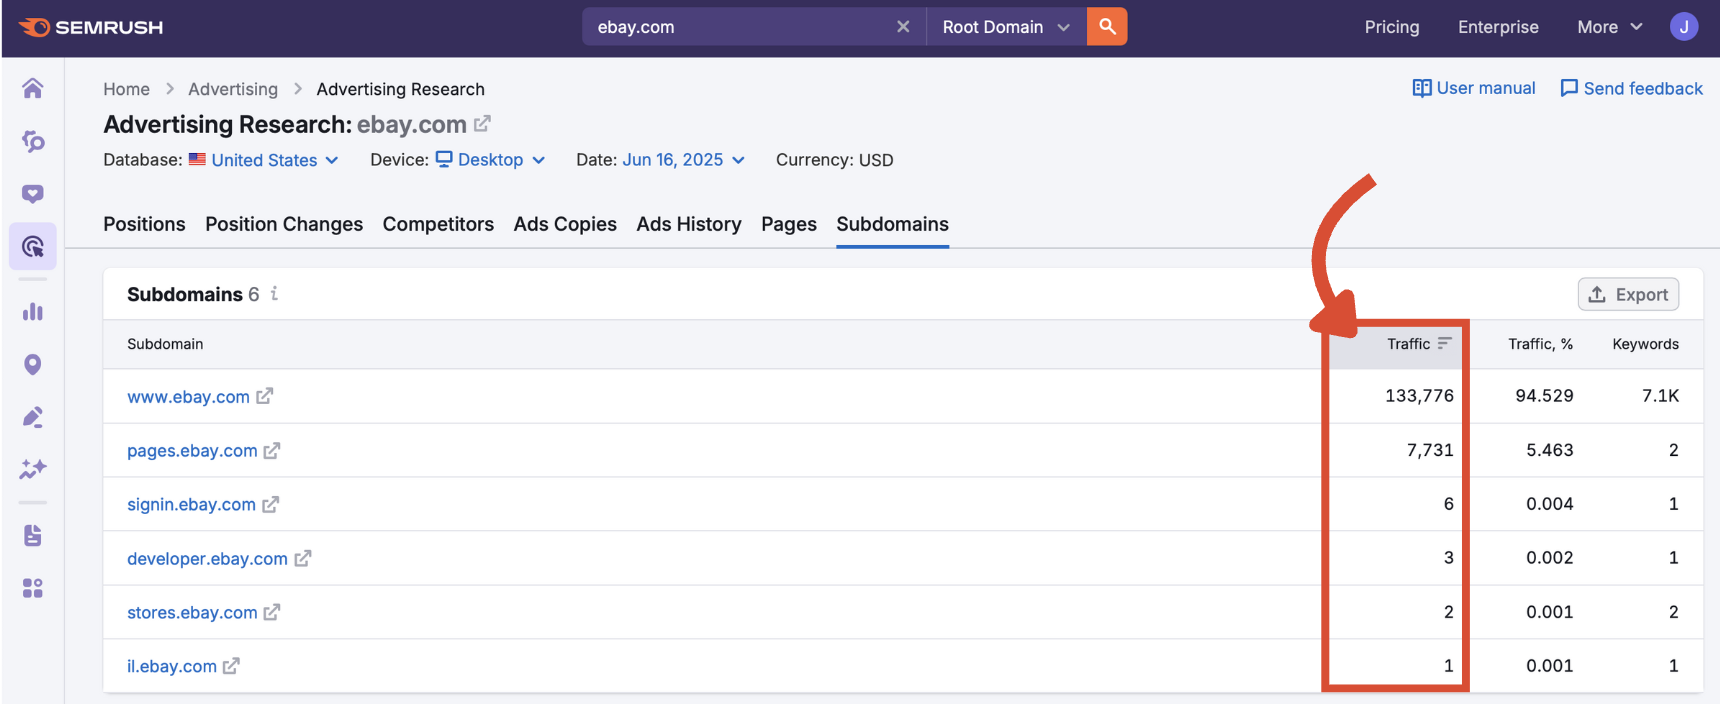
Traffic
Estimated number of monthly visits from paid ads. Higher numbers show where most ad spend is being directed.
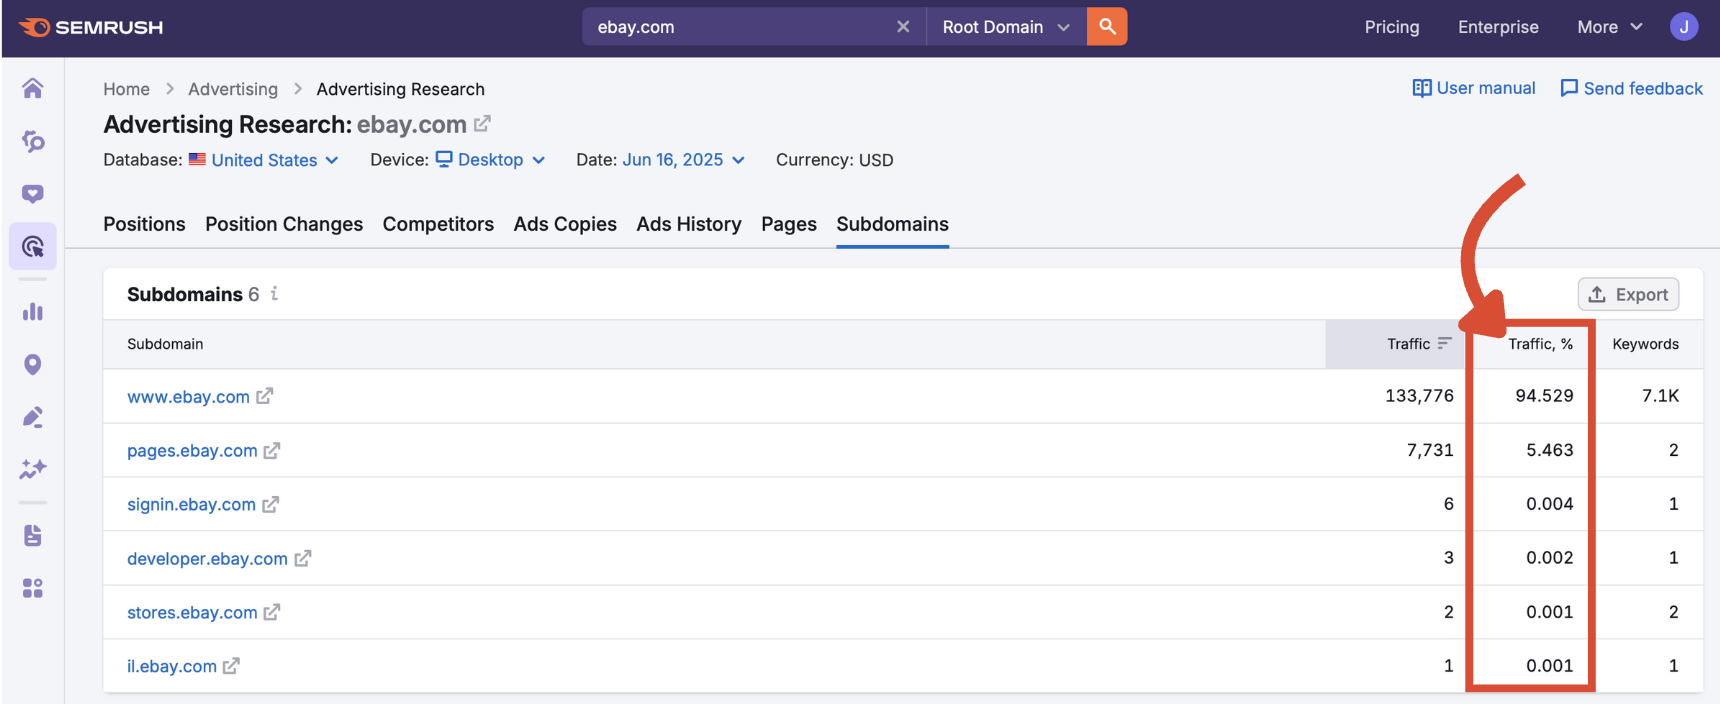
Traffic %
The share of total paid traffic that each subdomain receives. This reveals which subdomains are central to the advertiser’s strategy.
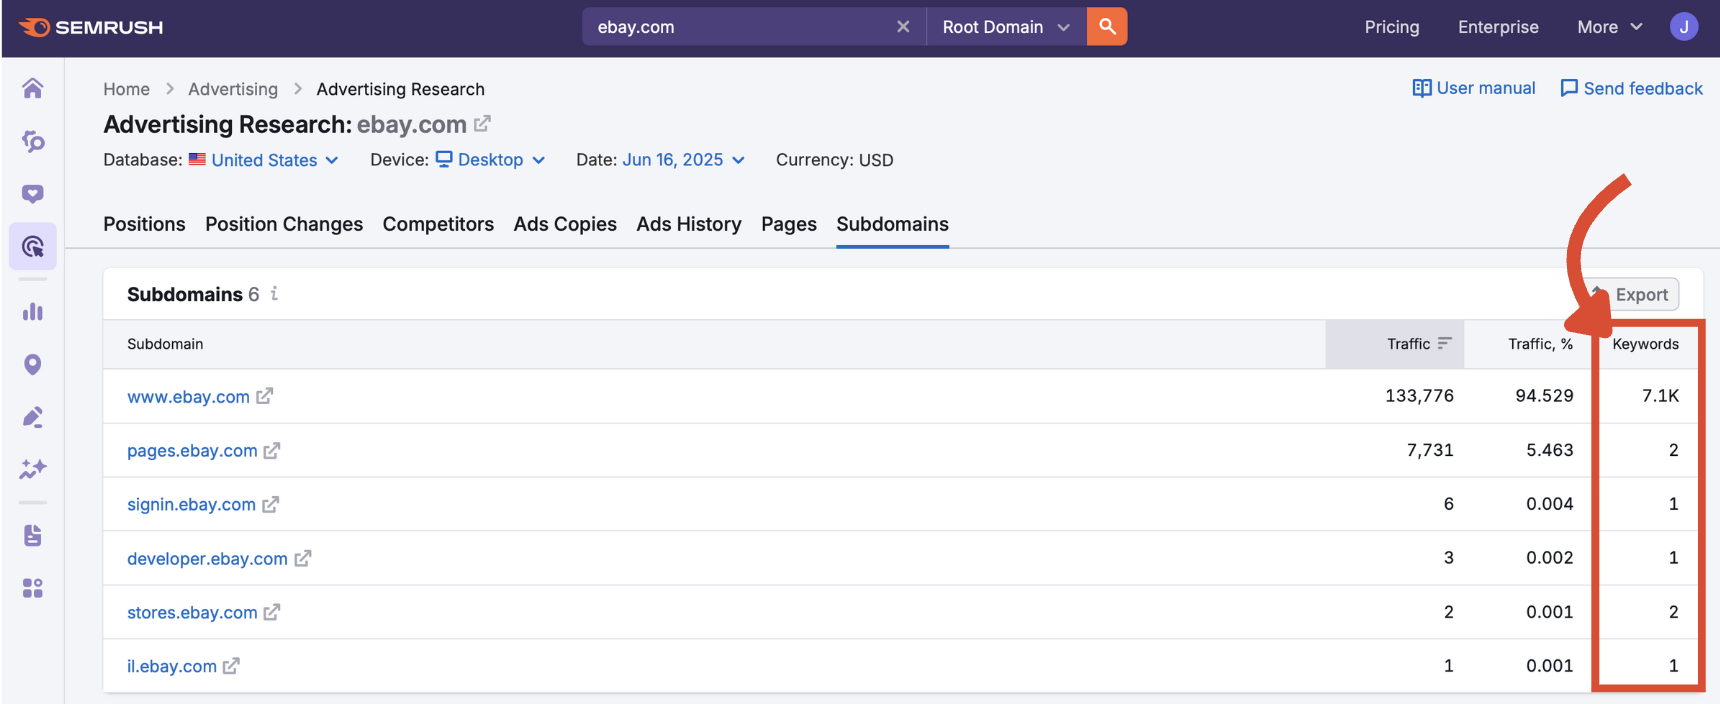
Keywords
Total number of keywords driving paid traffic to the subdomain. Hover over the contracted number for the exact figure.
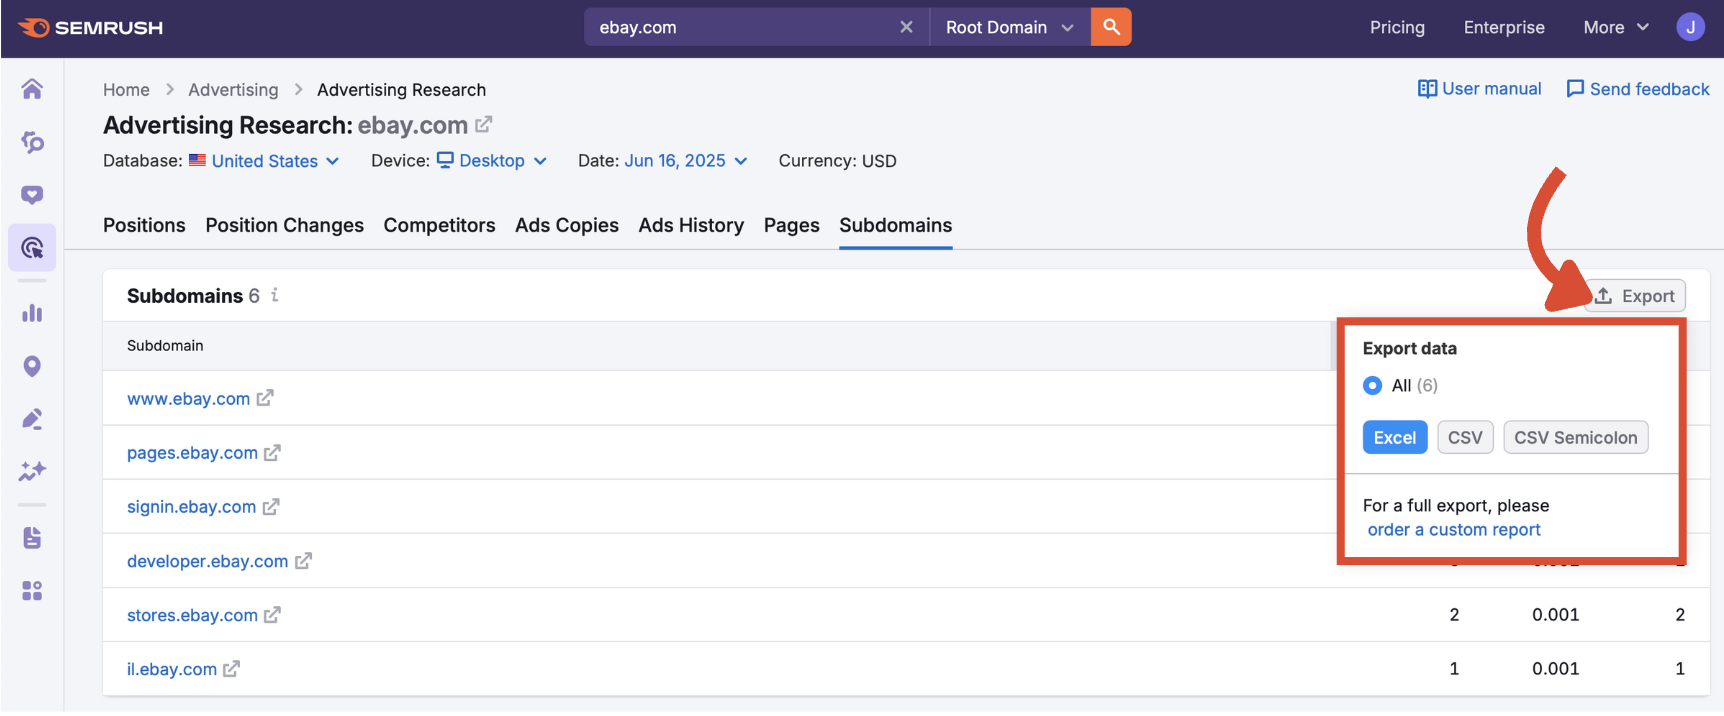
Step 3: Export for Analysis
To export the entire dataset, click the export button in the top-right corner of the table. Choose from Excel, CSV, or CSV (semicolon) formats.
Bring It All Together with the Subdomains Report
The Subdomains tab is the final piece of the Advertising Research puzzle. By combining subdomain insights with keyword, ad, and landing page data, you get a full picture of your competitor’s paid search priorities.
When you’re finished with the Subdomains report, you’ve now completed a full loop through the Advertising Research tool. You can always revisit:
- Positions to explore ad-triggering keywords and placements
- Position Changes to track keyword rank shifts
- Competitors to map out your PPC rival landscape
- Ads Copies to review messaging and creative strategy
- Ads History to spot long-term trends
- Pages to evaluate high-traffic landing pages
Together, these features help you manage your PPC strategy more effectively and improve your return on ad spend (ROAS).
To scale your research beyond individual domains, explore the full Semrush Advertising Toolkit to plan, execute, and optimize every step of your paid campaigns.